Self Learning Machines for the Multiplication of 2 numbers [Part 2]
Computation Graphs using TensorFlow
This is my first experience with TensorFlow to code a computation graph. TensorFlow has an inherit way of representing this computation graph which makes it a very intuitive tool for building these graphs. I have always been a fan of Octave which is quite handy in developing quick prototypes and validate models. But when it comes to production ready models w.r.t scale and flexibility it lacks the bite. This is where frameworks like torch,caffe and tensorflow shine. It is worth spending a little bit of time to understand the dynamics of these frameworks.More on this later.
Coding our Multiplication Graph
In the part1 of this series we got an intuition of how a machine learnt to solve the below problem.
result = a * b
Given the "result" and "a" , Find "b".

For example:
result=20
a=5
b=?
The TensorFlow code for the same is available at github
import tensorflow as tf

a = tf.constant(5.0,name = "a");
b = tf.Variable(50.0,name = "b");
res = tf.constant(15.0,name="result")
mul = tf.mul(a,b)
cost = tf.square(res-mul)
opt = tf.train.GradientDescentOptimizer(0.001);
train = opt.minimize(cost);

summary_b = tf.summary.scalar('Finding_Input2', b)
summary_cost = tf.summary.scalar('cost', cost)
summary_writer = tf.summary.FileWriter('log_Finding_Input2_stats')

with tf.Session() as sess:
    sess.run(tf.global_variables_initializer())
    print('Before Learning:: a={} b={} currentRes={} expectedRes={}'.format(sess.run(a),sess.run(b),sess.run(tf.mul(a,b)),sess.run(res)))
    for step in range(1000):
        summary_strb = sess.run(summary_b)
        summary_strcost = sess.run(summary_cost)
        summary_writer.add_summary(summary_strb, step)
        summary_writer.add_summary(summary_strcost, step)
        sess.run(train)
    print('Before Learning:: a={} b={} currentRes={} expectedRes={}'.format(sess.run(a),sess.run(b),sess.run(tf.mul(a,b)),sess.run(res)))
    summary_writer = tf.summary.FileWriter('log_multiplication_graph', sess.graph)
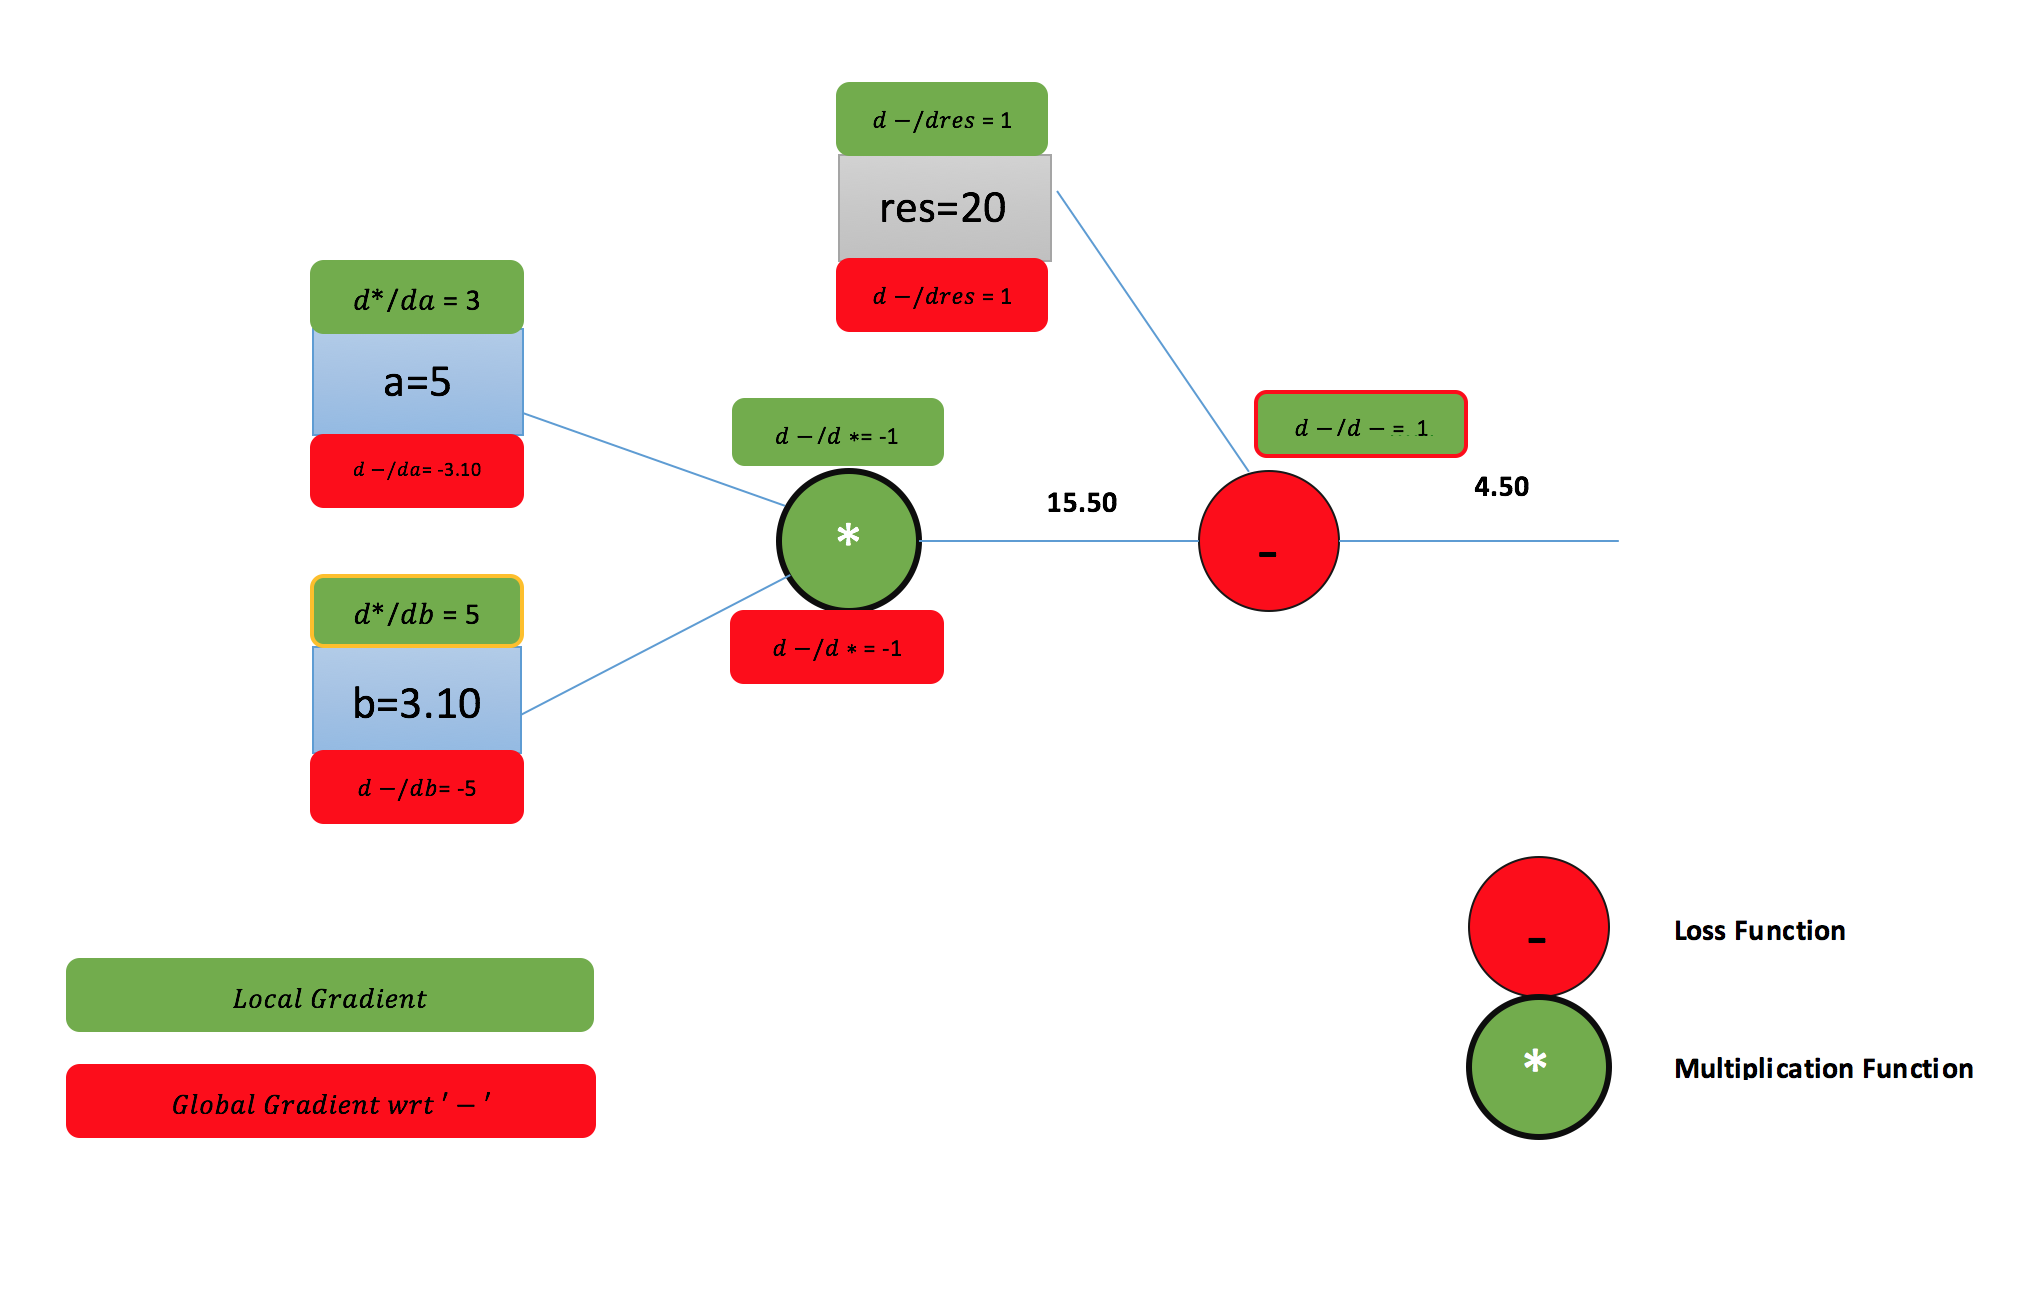
Lets have a look at the computation graph we had.

Dissecting the code
We have the inputs and the inputs go through a series of operations and finally we have the cost.
Accordingly we represent the inputs a,b,result and operations multiplication and cost in tensorflow as below.
a = tf.constant(5.0,name = "a"); # doesn't change. Hence a constant
b = tf.Variable(50.0,name = "b"); # To be Found . Hence a Variable
res = tf.constant(15.0,name="result")
mul = tf.mul(a,b) # Multiplication operation
cost = tf.square(res-mul) # # Cost operation
Lets define the Gradient descend optimisers to minimise the cost.
opt = tf.train.GradientDescentOptimizer(0.001); # 0.001 is the learning rate
train = opt.minimize(cost);
Then we train the model using
for step in range(1000):
	sess.run(train)
What is important to note here is the way we coded using Tensorflow.
We defined the inputs,operations and Optimisers in a way that is as close as it can to define the computation graph.
An other interesting aspect of Tensorflow is the visualisation of the Computation Graph using the TensorBoard.
To track the valus of the Variable ‘b’ during multiple steps of training.
Summary of the Variables
summary_b = tf.summary.scalar('Finding_Input2', b)
summary_strb = sess.run(summary_b)
summary_writer.add_summary(summary_strb, step)
Later these values are used for building a nice graphs as shown below.
The below graph shows how the computer found the second input b.

The below graph shows the minimisation of cost

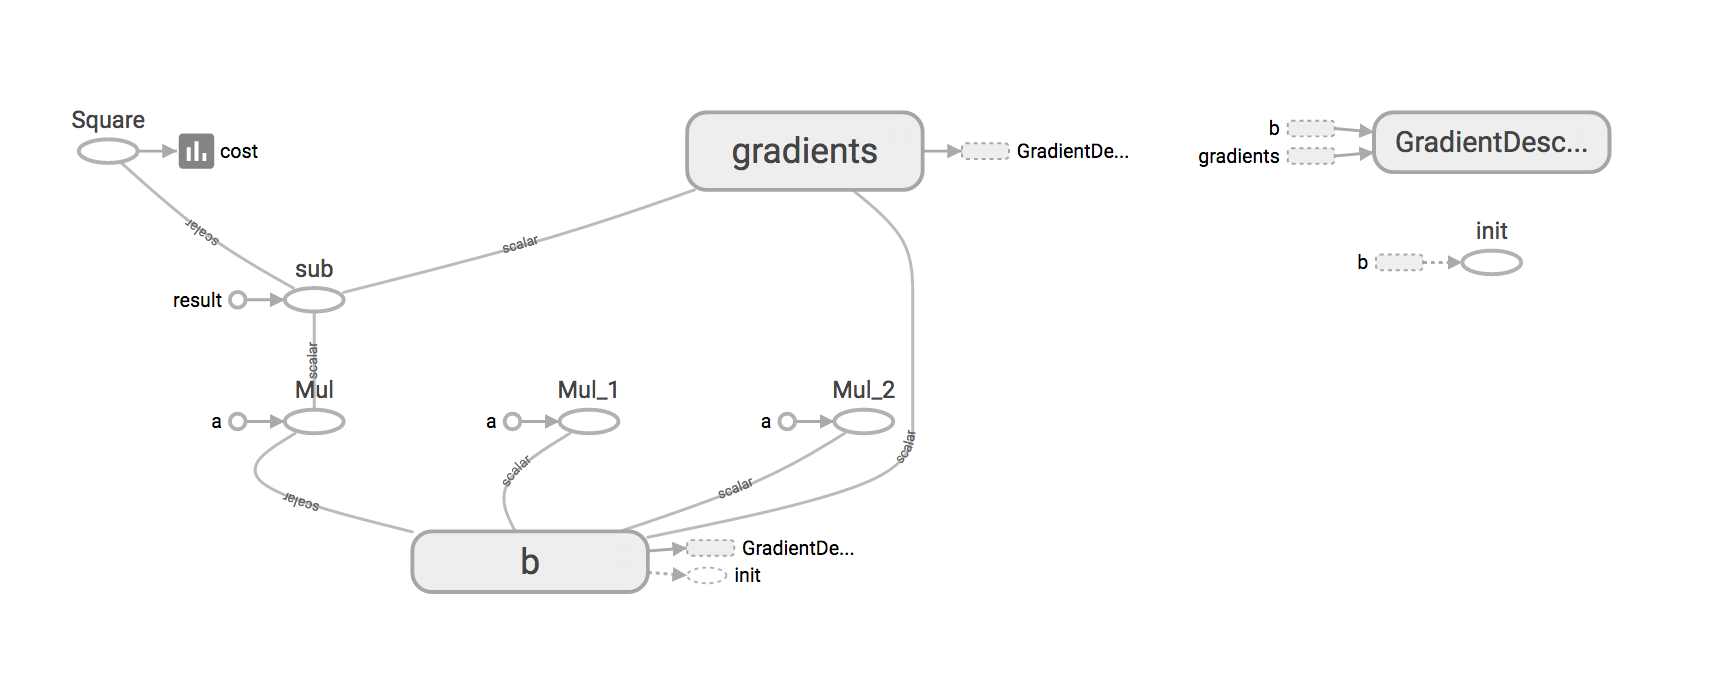
Computation Graph as seen by TensorFlow
There is a very nice way to visualise the computation graph.
summary_writer = tf.summary.FileWriter(‘log_multiplication_graph’, sess.graph)

Definitely my computation graph looked a lot better.Still need to figure out whats being projected as computation graph.